By Ardan Kumar | AKTV Trading Education
Read in Hindi: वो तीन धारधार टूल जो आपको Candlestick Patterns से हमेशा के लिए आज़ाद कर देंगे!
Table of Contents
Why Candlestick Patterns Are No Longer Enough
Friends, without any unnecessary talk, today I am going to tell you about three razor-sharp tools of market analysis that, if you understand them deeply, will mean you never need to get trapped in the confusion of candlestick patterns and chart patterns again.
Candlestick patterns and chart patterns are outdated now. Traders who rely on them are getting crushed in today’s markets. I am completely confident you have never seen a video like this anywhere on YouTube. So let us begin.
The Simple Logic of How Markets Move
As we all know, the logic of the market is completely simple. The market runs on three things: Liquidity, Volume and Inefficiencies. Every single market movement, whether up or down, can be accurately understood through these three elements.
At the top of this chain is Liquidity, which alone can shake the entire market. Liquidity means how many buyers and sellers exist in the market at any given point. Simply put , the more buyers and sellers, the more the market will move. And if there is no liquidity at all, price will not move and you will see very small candles forming.
The important thing to understand here is that liquidity can come from anywhere, but the real question is how much liquidity is coming.
Element 1: Volume: The Quantity of Liquidity
The quantity of liquidity is called Volume. Volume is the base of every market logic and strategy, it tells us how much money is entering the market or leaving it.
Volume is the most honest indicator in the market. It does not lie. Those who ignore volume and trade only on price,listen carefully, you will get fooled again and again.
Element 2: Inefficiencies: Where the Market Leaves Unfinished Business
Our third element is Inefficiencies, also called Imbalances in market language. These show the impact that volume is having on price. Inefficiencies are a graphical representation of volume at a specific point in time, and they change according to the time-frame.
To understand inefficiencies and the deep logic of market movement, we need to understand two factors:
Factor 1: Market State: The market can be in two states: Balanced and Unbalanced. When the market is in a balanced state, buying and selling volumes are equal and price moves very slowly. Neither buyers nor sellers are dominating. This state is actually quite rare. In an unbalanced state, either buyers or sellers have more volume. When buyers dominate, price goes up. When sellers dominate, price goes down.
Factor 2: Price Delivery Efficiency: This also has two types: Efficient Delivery and Inefficient Delivery. In every market movement, buyers and sellers exchange assets. If this exchange happens evenly it is called efficient delivery; but in reality this never happens perfectly. Sometimes buyers dominate, sometimes sellers. In inefficient delivery, if there are more buyers than sellers, some buy orders go unexecuted. If there are more sellers than buyers, some sell orders remain unfilled. This is exactly what becomes useful for our analysis.
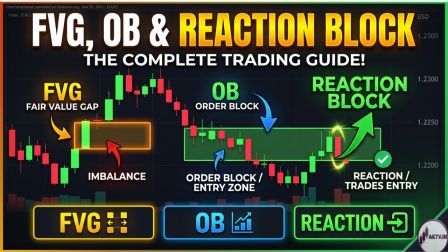
Tool 1: Fair Value Gap (FVG)
The most simple and powerful tool in our analysis is the Fair Value Gap (FVG).
A Fair Value Gap is a price action element that forms between three candles. In a bullish scenario, there is a gap between the high of the first candle and the low of the third candle; and they do not overlap each other. In a bearish scenario, it is the opposite; there is a gap between the low of the first candle and the high of the third candle.
A Fair Value Gap is a price reaction zone that forms due to sudden high liquidity or high volume entering the market. When a bullish FVG forms, the gap between the candle wicks shows a shortage of sellers compared to buyers; meaning people are ready to buy but cannot find a seller. Some buy orders remain unexecuted. This is the main reason the market comes back to test this zone repeatedly and reverses in the opposite direction.
The 0.5 Level: Mark the upper and lower boundaries of the FVG on your chart, and also mark the 0.5 level i.e. the midpoint. The 0.5 level is a very strong area from which price normally bounces back. You can use this as your entry point for a position.
FVG Validity Rule: When an FVG is bullish, price should normally not close below the lower boundary. The basic rule is; in a bullish FVG, price should not close below the lower level, and in a bearish FVG, price should not cross the upper level. If this happens, the FVG is considered violated and the chances of the previous movement continuing increase significantly.
Tool 2: Order Block
An Order Block is a price action element that shows the price range where the highest volume trading has occurred. The big players who manipulate the market use this heavily. Many people mistake the last candle before a reversal as the order block; but that is incorrect.
How Support and Resistance Connect: To understand Order Blocks, you first need to mark support and resistance on the chart. A resistance level forms when the first candle is a buy candle and the second candle is a sell candle; the area where the first candle closes and the second opens becomes your resistance. Similarly you can mark your support. Support and resistance are levels where the balance between buyers and sellers shifts; giving you a clue about where big players started or closed their positions. This is why whenever these levels are retested, high volume enters the market again.
How Order Blocks Form: When a breakout of a resistance level happens and price scans above it, a bullish Order Block forms. When price breaks below a support zone, a bearish Order Block forms.
Why Does Price React at Order Blocks? There are three main reasons:
First, the big players who took positions earlier to push price down still have those positions open in loss. When big players sense that the market is now going up, as soon as price tests the first half of the Order Block, they exit their positions. The closing of these short positions creates massive buying volume and price shoots upward.
Second; Order Blocks react due to unfilled orders and an increase in liquidity.
Third; an Order Block itself is a zone where the balance between buyers and sellers changes. If you look at an Order Block on a higher timeframe, it will appear to you as a Reaction Block; which we will discuss next.
Tool 3: Reaction Block
A Reaction Block has the same logic of operation as an Order Block; but its formation depends on which timeframe you are looking at and whether candle opening or closing is happening at that particular time.
A Reaction Block consists of two candles where our area of interest is the wick of both candles. It does not matter which wick is smaller or larger. If you have just one candle with a long tail, it should be considered a simple reaction; and it is a sign of volume entering the market. There are good chances that the next candle will continue the same movement.
The Key Insight: When you mark a Reaction Block on a higher timeframe and then switch to a lower timeframe, you will find that the same zone appears almost exactly as an Order Block. This is what makes this tool powerful; the same zone is valid across multiple timeframes.
How It All Connects
Friends, every movement in the market is interconnected. The buy and sell orders of one instrument keep creating traps for the next move. This is why you need to understand zones, not just individual tools.
Price always moves from one Zone of Interest to another; from Liquidity to Inefficiency or from Inefficiency to Liquidity, from Internal Liquidity to External Liquidity or vice versa. The market keeps moving this way continuously.
To summarise:
- Fair Value Gap: an unbalanced and inefficient element in the market that forms due to unfilled orders during position opening
- Order Block: also an unbalanced and inefficient element but forms during position closing rather than opening
- Reaction Block: the same concept visible across different timeframes
Conclusion
Friends, everything we explained today is based on deep research. You can add your own knowledge to this and improvise further. These three tools, when understood together; give you a complete picture of why price moves where it moves, without needing to memorise dozens of candlestick patterns.
Study them. Practice them on charts. And most importantly; combine them with Volume to confirm every signal.
Watch complete video on Fair Value Gaps, Order Block and Reaction Block
Read in Hindi: वो तीन धारधार टूल जो आपको Candlestick Patterns से हमेशा के लिए आज़ाद कर देंगे!
⚠️ Disclaimer: This article is for educational purposes only. We are not SEBI registered. Nothing here is investment advice. Trading involves significant risk of loss. Always do your own research before trading.
Written by: Ardan Kumar | Founder | aktv.in