🗓️ Last Updated: 20 Apr 2026
Ardan Kumar | AKTV | Trading Education| 10 minutes read
Read in Hindi: कौन सा Timeframe सही है? हर ट्रेडर को यह जानना ज़रूरी है
Table of Contents
In technical analysis, the world of timeframes is one of the most misunderstood topics for retail traders. From 1 minute to 1 month, every timeframe has its own purpose, its own advantages and its own risks.
But the real question is: which timeframe should you be trading in?
If this question bothers you every time you open a chart, this article will clear everything up. Today I am going to explain every major timeframe in detail; what it is good for, who should use it, and exactly how to time your entries and exits using multiple timeframes together.
Monthly Timeframe: For Long Term Investors
The monthly timeframe is used for long term investing; positions that are held for months or even years.
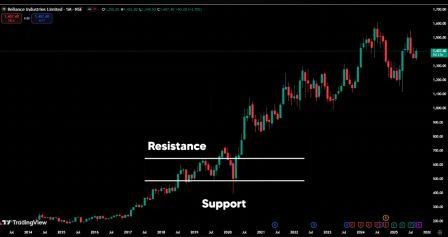
Take Reliance as an example. On the monthly chart you can clearly see a resistance level that was tested multiple times over a long period. The moment price broke out of that resistance with conviction, the stock never looked back; it went from around Rs 450 all the way to Rs 1270. That kind of move is only visible; and tradeable; on the monthly chart.
This is the real power of the monthly timeframe: you see big, clean moves. The noise of daily fluctuations disappears. Long term trends become obvious.
One thing to look for on monthly charts is a clean trend. If price is consistently making higher highs above EMA 50, that is an unambiguous uptrend. You should be able to look at the chart and immediately know the direction; no confusion, no second-guessing.
The biggest advantage of monthly trading is that you do not need to sit in front of your screen every day. You need just 2 to 10 hours of work per month. Look at the chart once, make your plan, and then go live your life for the rest of the month.
The honest trade-off: returns come slowly. Not everyone has the patience for this in the markets. But those who do build portfolios that are genuinely strong and sustainable over time.
Weekly Timeframe: For Positional Trading
The weekly timeframe is ideal for positional trading; trades that typically run from 10 days to 3 months.
And for beginners who seriously want to build trading as a career; this is where you should start. Not intraday. Not options buying. Positional trading first, then step by step from there.
Most new traders do the opposite. They jump straight into intraday, then into options, and when losses happen they blame the market. The smarter path is to first learn to be profitable in positional trading before moving to shorter timeframes.
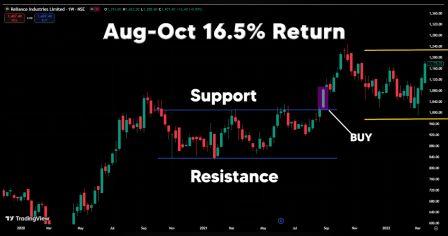
Here is a real example. For 8 to 9 months a stock was stuck in a range; bouncing between support and resistance. The moment resistance broke, a buy signal formed. Price was around Rs 130 at that point. After the breakout, the stock moved straight to Rs 1200; a return of nearly 16.5% in just 3 months.
This is positional trading done right: less time, less stress, solid profits.
Who can do this? Anyone. It does not matter if you have a job, run a business or are a teacher. You just need to dedicate two days a week. Sit down on Saturday and Sunday, review your watchlist and decide which stocks have setups forming for the coming week.
You will need to scan through 80 to 90 stocks to find the ones with clean breakout setups. But today you have tools to help with this: screeners and charting platforms can filter the list down for you significantly.
One mindset point: when you choose the weekly timeframe, you will not get as many trades as on daily or intraday charts. That is fine. The mindset has to match the timeframe. Patience is not optional here; it is the strategy.
Daily Timeframe: For Swing Trading
The daily timeframe is the most widely used and arguably the most important of all timeframes; it serves long term investors, positional traders and intraday traders alike.
For swing trading specifically; holding trades for a few days to a few weeks; the daily chart is your primary tool.
The setup is straightforward. Draw a trendline connecting the swing lows. When price approaches the trendline, that is your entry zone. When price hits your target, exit. Price pulls back to the trendline again; re-enter. You keep taking these swing trades as long as support holds.
In swing trading, if you are getting 2 to 3% per trade, that is a healthy and realistic target. Do not let greed push you to hold beyond your planned exit.
You can also use a moving average as your guide; enter when price crosses above the moving average, exit when price hits your target, re-enter on the next pullback to the moving average. Simple and repeatable.
Why the daily chart is the most important timeframe: the uptrends that are visible on weekly and monthly charts are always caught earliest on the daily chart. When a long term trend is just beginning, the daily chart is the first place it shows up clearly.
The one challenge: the daily chart gives you too many opportunities. In Nifty 500 alone you will see dozens of setups at any given time. The real skill; and the real edge; is choosing the right stocks and staying focused on a small number of high-quality setups instead of chasing everything.
15 Minute and 30 Minute Timeframes: For Intraday Trading
For intraday trading, the 15 minute and 30 minute charts are the most effective. This is where serious intraday traders do their primary analysis.
The rules of intraday are straightforward: the market opens at 9:15 AM and closes at 3:30 PM; all positions must be squared off within that window. Stick to large, liquid stocks; small and mid-cap stocks have wider spreads and more erratic intraday behavior.
Here is a real example on the 15 minute chart. Price opens the session and immediately starts crossing the moving average upward; that is your entry signal. From 9:15 AM to 2:15 PM, the move delivers approximately 1.8% profit. That is a solid intraday return from a single clean setup.
Each moving average has a different optimal setting for different timeframes; the parameters you use on a daily chart will not work the same way on a 15 minute chart.
The honest risk: intraday trading carries far more risk than swing or positional trading. Trades can go against you quickly. Targets sometimes are not reached and you end up with a loss instead. Daily profits are possible; daily losses are equally possible. Never trade intraday with money you cannot afford to lose on any given day.
1 Minute, 3 Minute and 5 Minute Timeframes: For Scalping
Scalping is the fastest style of trading. You give it 2 hours in the morning and walk away.
The opportunities in scalping are concentrated in the first 2 hours of the trading session. If your setup is not there by 11:00 AM, it is usually better to stop and come back the next day.
A simple example: price opens at 9:15 AM and moves sharply upward. If you enter the buy at the right moment and exit at the target, you can capture approximately 1.47% in just 50 minutes from 9:15 to 10:05 AM.
This is scalping; fast entry, fast exit and equally fast risk.
The challenge with scalping is that it requires instant decision-making. There is no time to think. If you hesitate; even for a few seconds; the move is over and the opportunity is gone. This is why not everyone can scalp successfully. It is an aggressive trading style that demands both speed and iron discipline simultaneously.
The risk in scalping is also the highest of any timeframe. What can be made quickly can also be lost just as quickly.
Which Timeframe Is Right for You?
Now to the most important part: when should you enter and which timeframe should you use?
If you are a long term investor:
Do your analysis on the monthly timeframe. The monthly chart gives you a full 360 degree view of the market. If the monthly chart is making higher highs, the trend is strong and the direction is clear. Entry can be confirmed on the weekly chart.
For positional trading:
Find your stocks on the monthly timeframe but take your entry using the weekly chart. The weekly chart shows you where the correction is happening; and entry near a correction point in a strong long term trend is always the best entry. Big trend from monthly; precise entry from weekly.
For swing trading:
Select your stocks from the weekly and monthly charts. Take your entry using the daily chart. This way you are only trading stocks with a strong overall trend; and you are catching the short term moves within that trend at the right moment.
Simple principle: the big picture must be strong. That is when the smaller picture gives you money.
For intraday and BTST trading:
Select your stocks from the daily chart. Look for stocks where a significant level has been broken with volume; a breakout or breakdown with conviction. These stocks tend to carry strong short term momentum.
Take your trades on the 15 minute or 30 minute chart. This gives you accurate entry and exit signals with a stop loss that can be kept tight.
For scalping:
Select your stocks from the 1 hour chart. Take your trades on the 1 minute, 3 minute or 5 minute chart. Speed is everything here. Small profits, taken frequently, add up over a session.
Multi-Timeframe Analysis: The Real Edge
The most powerful approach combines timeframes systematically: use the bigger timeframe for direction and the smaller timeframe for entry timing.
| Trading Style | Direction (Higher TF) | Entry (Lower TF) |
|---|---|---|
| Long Term | Monthly | Weekly |
| Positional | Monthly | Weekly |
| Swing | Weekly / Monthly | Daily |
| Intraday | Daily | 15min / 30min |
| Scalping | 1 Hour | 1min / 3min / 5min |
This approach gives you two advantages simultaneously. First, you only trade stocks that have a strong overall trend working in your favour. Second, your entry timing is precise because the smaller timeframe shows you the exact levels and signals to act on.
How AKTV Tools Fit Into This
AKTV Swing tracks MA50 fresh crossovers on Nifty 50 stocks on the 30 minute chart; designed specifically for swing traders who want clean, filtered setups without scanning hundreds of charts manually.
AKTV Radar scans 200 plus NSE stocks every 5 minutes for EMA crossover signals; the ideal tool for intraday traders working on the 15 minute timeframe.
AKTV Sniper tracks the Opening Range Breakout on NIFTY and SENSEX options in real time; built for intraday options traders who need a clear, structured signal with all filters in one place.
Conclusion: Choose the Mindset, Not Just the Timeframe
The timeframe you choose is less important than the mindset you bring to it.
If you choose monthly; wait months. Do not panic every week when the chart dips.
If you choose weekly; wait days. Do not react to every candle.
If you choose intraday; square off the same day. Do not carry positions overnight hoping for a recovery.
If you choose scalping; bring speed and discipline in equal measure. One moment of hesitation can turn a winning setup into a loss.
Every timeframe works. Every timeframe has produced successful traders. The one that works for you is the one that fits your lifestyle, your risk tolerance and your ability to wait.
Trade with discipline in any timeframe and your portfolio will show it over time.
Watch complete video with charts: Click Here
Read in Hindi: कौन सा Timeframe सही है? हर ट्रेडर को यह जानना ज़रूरी है
Also read: Risk Management in Trading: Why New Traders Lose All Their Capital
Also read: Trendline Trading Strategy: The Right Way to Draw and Trade Trendlines
Also read: Why You Should Avoid Trading on Fridays
Hindi version: कौन सा Timeframe सही है?
Disclaimer: This article is for educational purposes only. AKTV is not registered with SEBI. Nothing here constitutes investment advice. Trading involves substantial risk of loss.
Written by: Ardan Kumar | Founder | aktv.in
About the Author
Ardan Kumar
Ardan Kumar is the founder of AKTV, a free trading education platform for Indian retail traders. He served 8 years in the Indian Air Force as an Aircraft Maintenance Engineer, working on Mi-17 helicopters and earning special service medals for Operation Rhino in the Mizo and Naga Hills. After leaving the Force, he entered the stock market, learned trading the hard way, and built AKTV to teach others what took him years to figure out. He holds an MBA in Marketing and Finance from CRSU Jind where he topped the course, and has cleared UGC-NET in Management. He is also the co-founder of One Percent Capital LLC, Texas, USA. His YouTube channel AKTV Business has over 27,000 subscribers. Everything on AKTV is free: no login, no payment, no hidden charges.
kudos to you