🗓️ Last Updated: 31 May 2026
Ardan Kumar | AKTV | Trading Education | 09 minutes read
Read in Hindi: SLC Trading System: Supply और Demand को सही तरीके से Trade करना सीखो
Table of Contents
You marked the supply zone. You waited patiently for price to return. It touched the level and you took the trade, expecting a bounce.
Instead, price sliced right through it and your stop loss got hit.
Now you think supply and demand does not work.
Before you write it off completely, consider this: supply and demand is one of the core strategies that has helped serious traders build consistency over years. The problem is not the concept. The problem is that most traders use only one piece of a much larger puzzle.
The Real Reason Most Traders Fail at This
Supply and demand zones identify areas where aggressive buying or selling happened in the past. The idea is that when price returns to those areas, the same buyers or sellers will step in again.
That logic is sound. But a zone by itself does not tell you whether this is the right time to enter, what the broader market is doing, or whether the bounce is actually happening or just faking you out.
You need more context. That context comes from the SLC System.
S stands for Structure. L stands for Level. C stands for Confirmation.
If you are currently trading only supply and demand levels, you have the L part. The other two are what complete the picture.
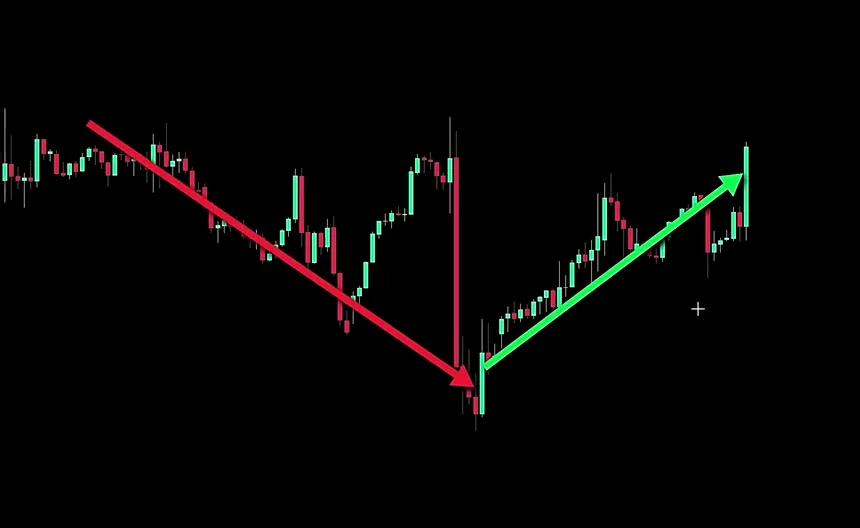
S: Reading the Market’s Direction
Before looking at any level, you need to know which direction the market is moving.
There are three possibilities. An uptrend, where price makes higher highs and higher lows. A downtrend, where price makes lower highs and lower lows. And a ranging market, where price moves sideways without clear direction.
In the SLC system, trades are only taken during uptrends and downtrends. Ranging markets are left alone.
The reason structure comes first is simple. It tells you which side to trade. In an uptrend you only look for long trades. In a downtrend you only look for short trades. This one rule alone eliminates a huge number of bad trades that go against the prevailing momentum.
Think of it like swimming in a river. Swimming with the current takes less effort and covers more distance. Fighting the current is exhausting and slow. Market structure is your current. Trade with it.
For structure, use a higher timeframe like the 1-hour chart. You want to see the bigger picture before zooming in.
One important thing: base your structure on the most recent price movement. If the market was in a downtrend three months ago but has since reversed and started making higher highs, the current structure is an uptrend. The past does not matter here, only the latest swing.
L: Finding the Right Zone
Once you know the structure, you move to the L part: identifying your level.
Because structure determines trade direction, it also filters which levels are relevant. In an uptrend you only look for demand zones. In a downtrend only supply zones. This keeps your chart clean and your analysis focused.
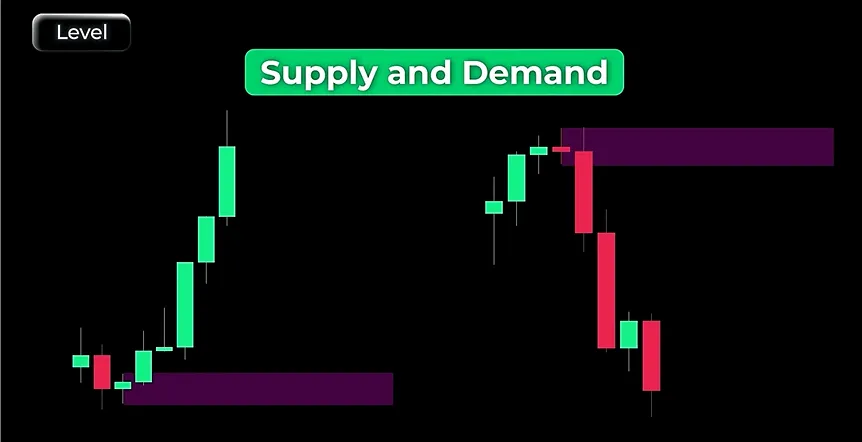
How to find a demand zone:
Look for a point on the chart where price made a sharp, aggressive move upward. The area just before that move started is your demand zone. Mark it with a rectangle.
The logic is straightforward. That sharp move happened because buyers stepped in aggressively at that area. If price pulls back to that same area, those buyers are likely to return and push price up again.
How to find a supply zone:
Same idea in reverse. Find where price made a sharp downward move and mark the area just before it started. That is where sellers were aggressive. If price returns there, sellers are likely to appear again.
Not every move qualifies. Small bumps and minor pushes do not count. You are looking for strong, clear impulse moves where price covered significant distance quickly. The stronger and faster the original move, the more reliable the zone.
Drop to a lower timeframe like the 1-minute or 5-minute chart to draw your levels precisely. Keep them aligned with the structure direction you identified on the higher timeframe.
C: Waiting for Confirmation
This is the step most traders skip, and it is the most important one.
Confirmation means waiting for additional evidence that the level is actually holding before you enter the trade.
Without this step, you are guessing. Price touches the zone and you jump in hoping for a bounce. Sometimes it works. Often it does not, because price was just passing through.
Confirmation gives you a specific signal to wait for, something that tells you the reaction is actually starting, not just beginning to look like it might.
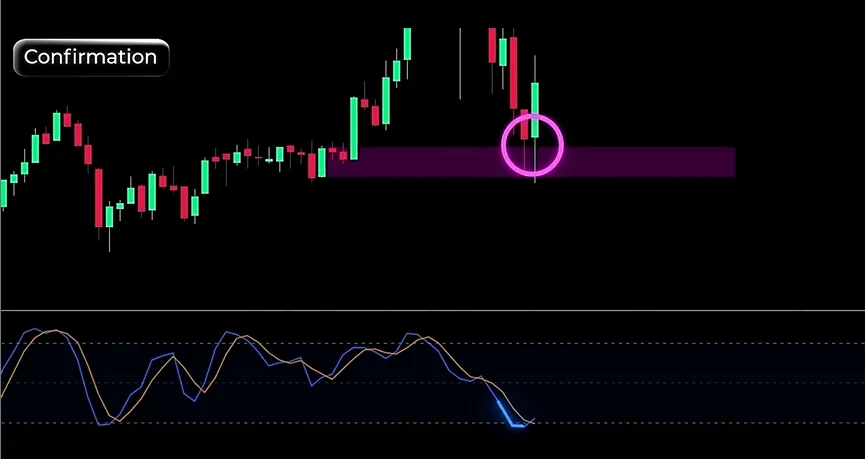
In the SLC system, a Stochastic indicator is used for this purpose. Add it to your chart through the indicator section by searching for Stochastic. Use these settings as a starting point:
%K Period: 14 %D Period: 3 Slowing: 3
The specific confirmation to look for is this: when price reaches your demand zone, wait for the Stochastic blue line to drop below the oversold level and then cross back above it.
This crossover tells you that price was oversold and momentum is starting to shift. It is not a guarantee, but it adds a meaningful layer of evidence that a bounce is developing rather than just possible.
Putting It Together: A Complete Trade
When all three parts align, this is how the trade looks:
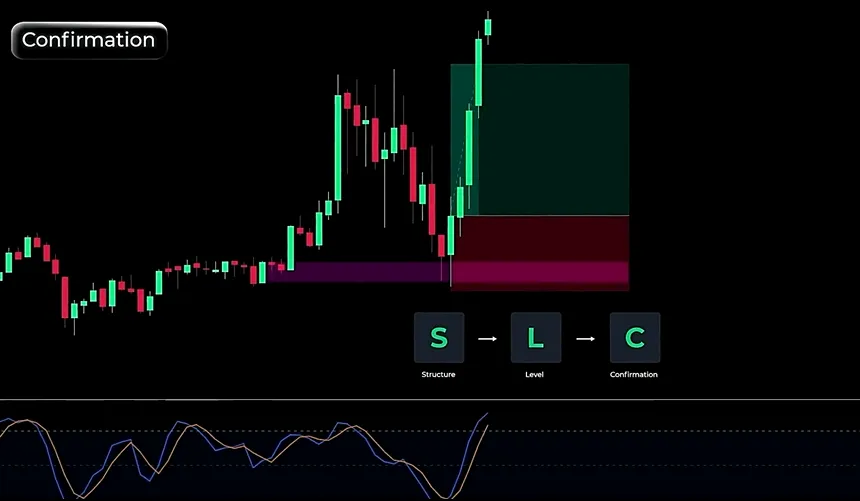
Price is in an uptrend on the 1-hour chart. You drop to the 1-minute chart and find a clear demand zone where a strong upward move started previously. Price pulls back and reaches that demand zone. You watch the Stochastic. It drops below the oversold line and then crosses back above it.
That is your entry signal. You go long.
Stop loss goes below the demand zone. Take profit is set at 2R, meaning twice the distance of your risk.
The reason this works better than using supply and demand alone is that you are combining three independent pieces of analysis. Structure tells you the direction. The level tells you where to look. Confirmation tells you when to act.
Each piece filters out a different type of bad trade.
A Few Things Worth Saying
No trading system wins every time. The SLC system is a framework for making structured decisions, not a shortcut to consistent profits. Markets are unpredictable and losses are a normal part of trading.
Practice this on a demo account before using real money. Take time to understand each component before combining them. And always manage your risk on every trade regardless of how good the setup looks.
Preparing for the Market
Having a system is one part of trading well. Knowing what the market is doing before it opens is another.
Every morning before 9:15 AM IST, AKTV Market Pulse compiles the key data that matters for Indian traders: FII and DII flows, India VIX, PCR, Max Pain, and key levels for NIFTY and SENSEX. All in one place, completely free, no login required.
For those who trade NIFTY and SENSEX options, AKTV Sniper runs a rule-based scanner that alerts when specific conditions are met across ORB, PDH/PDL, and Supertrend strategies. Alerts go to Telegram automatically.
Both tools are free at aktv.in.
The Short Version
Supply and demand works. Using it in isolation often does not.
The SLC system adds two things that make it significantly more reliable. Structure keeps you trading in the direction of momentum. Confirmation keeps you from entering too early.
Add those two layers to the levels you are already drawing and you will notice the quality of your setups improve considerably.
The next part of this series covers additional confirmation methods that can be combined with Stochastic for even more precise entries.
Watch complete video tutorial: Click Here
Read in Hindi: SLC Trading System: Supply और Demand को सही तरीके से Trade करना सीखो
Also read: Fair Value Gap; Order Block and Reaction Block
Also read: Fake Breakout: How the Stock Market Traps Retail Traders
Also read: Risk Management in Trading
Disclaimer: This article is for educational purposes only. Nothing here constitutes investment advice or a recommendation to buy or sell any security. Trading involves risk and past performance of any strategy does not guarantee future results. Please consult a SEBI-registered financial adviser before making any investment decisions. AKTV and Ardan Kumar are not registered with SEBI.
Written by: Ardan Kumar | Founder | aktv.in
About the Author
Ardan Kumar
Ardan Kumar is the founder of AKTV, a free trading education platform for Indian retail traders. He served 8 years in the Indian Air Force as an Aircraft Maintenance Engineer, working on Mi-17 helicopters and earning special service medals for Operation Rhino in the Mizo and Naga Hills. After leaving the Force, he entered the stock market, learned trading the hard way, and built AKTV to teach others what took him years to figure out. He holds an MBA in Marketing and Finance from CRSU Jind where he topped the course, and has cleared UGC-NET in Management. He is also the co-founder of One Percent Capital LLC, Texas, USA. His YouTube channel AKTV Business has over 27,000 subscribers. Everything on AKTV is free: no login, no payment, no hidden charges.